 How to Run a Windows 10 System Health Check
We all should have a health checkup once in a while. Since I’m working with EB, I get so many maladies it seems like I’m always at some kind of “ologist”. I think I have 7 “ologists” now. However, I’ll never admit to seeing the ologist that begins with Psych. Should I dare tell you about the one that begins with C a r d i?
Moving along with my humorous and nifty segue…
All of us should get regular checkups. And your PC should get a checkup every once in a while, too. Yes, EB, this is your first chance to play doctor since you were a little kid. And since you’re reading this, you can play doctor too.
Here’s how to generate a health report for your PC.
- Press and hold down the Windows Key and tap the R key to open the Run dialog:
- In the Run box type PERFMON /REPORT
- Click OK or press Enter
You can use lower case or upper case letters in the Run box… Windows could not care less!
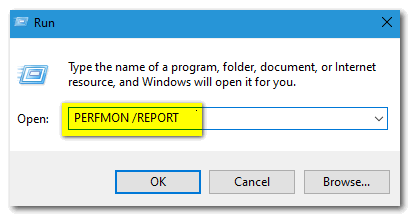
See? Make sure you leave a space after PERFMON before the slash. Then click OK or press Enter
Big wheels keep on turnin’, Perfmon just keeps on a’burnin’ …
Perfmon (Performance Monitor) will collect data from your PC for roughly 60 seconds. If I were you, I wouldn’t get a stopwatch and time it. Windows does what Windows does and in its own good time. You can figure roughly 60 seconds, though… OK?
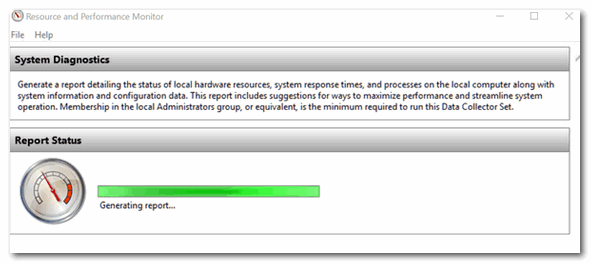
After approximately a minute or two, you’ll see that Perfmon starts generating a health report for your PC.

Then, if all goes well, you’ll get yourself a dandy report covering all the goings on inside your PC. Don’t get paranoid if you find a few errors. Very few reports like this come out without showing any errors. Another words, if you’re PC is running well, don’t over-diagnose.
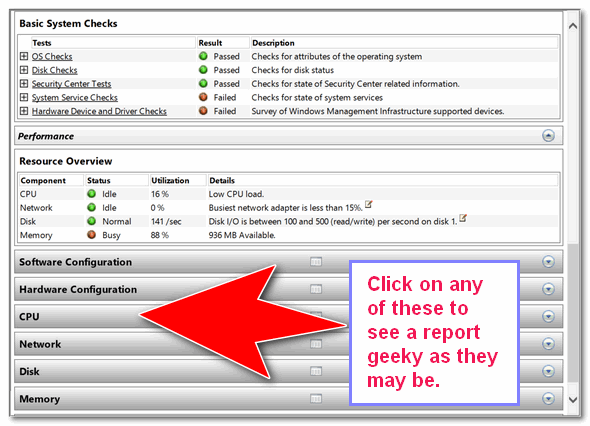
Below, it shows my computer has passed all the tests… Yeah! If yours shows an error or errors, click on the error(s) to find out what is causing the error(s).
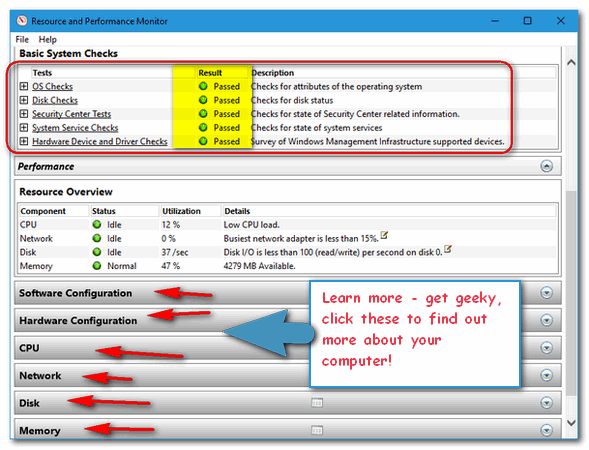
You can get a great deal of information about your computer from a Perfmon report. Look at the screenshot directly above. You can see what’s going on with your software and hardware configurations, CPU, Network, Memory and a lot more. All you have to do is click on a category to expand it. Some of the information might be a little geeky, but so what? You have a browser and Google right? Search for the error you see and you just might learn something new. Search and learn.
And, EB, when you read this, pay no attention to that man behind the curtains that says my disk is idle. I’m workin’, I tells ya!
An Alternate Way to Run a Windows 10 System Health Report (aka Perfmon Diagnostics Report)
If for some reason, you can’t run a performance report the easy way (as above), here’s an alternate way to run the report.
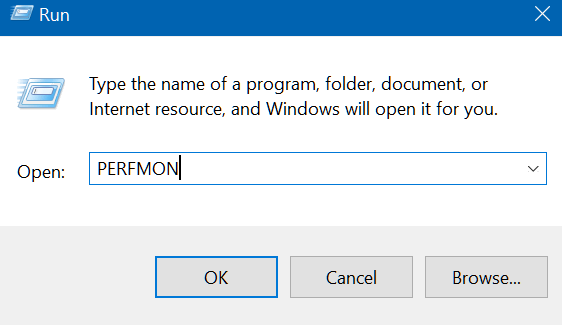
- Press & hold down the Windows Key and tap the “R” key.
- Type PERFMON and press ENTER
3. When Perfmon — Performance Monitor — opens Expand the items in the left pane and locate “System”.
4. Expand “System” by clicking the down arrow to the left of its icon.
5. Right-click on System Diagnostics and choose “Start” from the right-click menu which appears. See below:

You will see the following – showing that Perfmon is collecting data for your report. It says it will take 60 seconds. It may take a little bit long but not more than 3 minutes.
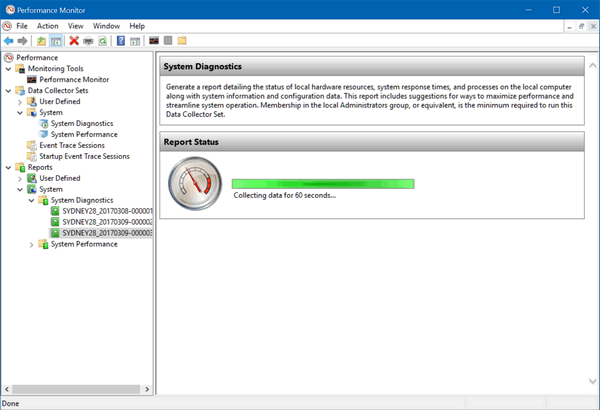
When Perfmon has collected enough data, will automatically generate a System Diagnostics Report.
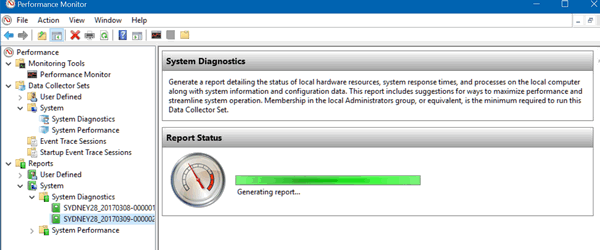
The report, when finished will be saved. It may not automatically appear. To see it…
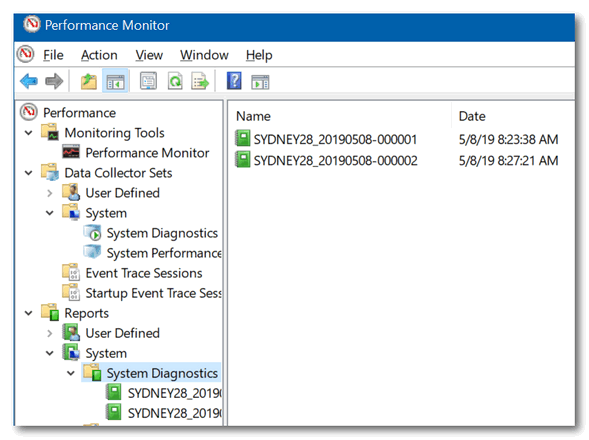
In Perfmon —> System, click on System Diagnostics. You’ll see your report appear in the right pane. As you can see below, I have run 3 Perfmon System Diagnostics reports – aka health reports. Just click on the report to see it.
The Health Report (or more properly called the Perfmon Diagnostics Report) looks like this:
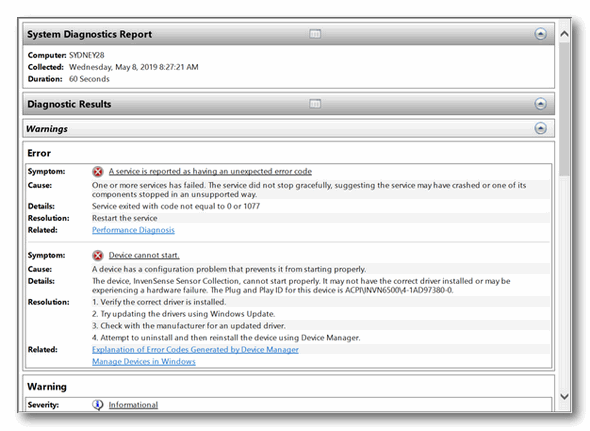
There’s a lot of info contained in the report, you’ll need to scroll down and open the categories to see everything. You can get an idea of how much information you can get from this report by looking at the screenshot below.
PLEASE DON’T WORRY:
Again, we want to remind you that just because you see an error or errors does not mean you need to panic or reset your computer. If your PC is running fine you may just want to leave things alone. But if you’re having problems, a System Health Report aka a Perfmon Diagnostics Report can help you isolate and fix the problem.


After a few seconds this is what happened — “Error:
An error occured while attempting to generate the report.
The Data Collector Set or one of its dependencies is already in use. “
I tried to run it but I came up with “Report Generation Toll Timed Out” Twice.
If you look at the bottom of the article, I’ve added an alternate way to run the report.
Same result as Janis
perfmon /report, not perfmon/report
Mine says “windows cannot find perfmon/report. Make sure you typed the name correctly and try again.
It’s not perfmon/report it’s perfmon /report. There’s a big difference 🙂
If you look at the bottom of the article, I’ve added an alternate way to run the report.
I did a copy and paste in the Run dialog ‘PERFMON /REPORT’
The result came up very quickly .. passed all the tests
Saved the results in a folder I made up with todays date, so that I may have a comparison in the future.
If you look at the bottom of the article, I’ve added an alternate way to run the report.
Mine worked perfectly, no errors
I got 4 instances all on the same report:
X device drivers need to be reinstalled
A device has a configuration problem that prevents it fron working properly
The device *UNKNOWN* i s reporting “tv_ConfigMgrErr”This device will not be available until the issue is resolved. The plug and play ID for this device is ROOT/PRINTER /0000 ( repeated for 0001,0002,0003)
1. Verify the correct driver is installed
2. Try updating drivers using Windows Update
3. Check with the manufacturer for an updated driver
4. Attempt to uninstall and reinstall the device using Device Manager
(link) Explanation of Error Codes Generated by Device Manager
Manage Devices in Windows
Now I know thundercloud always says not to fool around with drivers so what do I do?
We never ever said don’t mess with drivers. We said never install driver updater programs… and if all your hardware is working correctly don’t worry about updating drivers.
At the very bottom of the article we posted this:
PLEASE DON’T WORRY:
Again, we want to remind you that just because you see an error or errors does not mean you need to panic or reset your computer. If your PC is running fine you may just want to leave things alone. But if you’re having problems, a System Health Report aka a Perfmon Diagnostics Report can help you isolate and fix the problem.
Is everything working to your satisfaction? Then there’s nothing you need to do. And here’s what we said about drivers…
I found this report to be very useful, thank
So much information, it’s confusing to know what is what & what to do or not do :o(
I ran PERFORM /REPORT Got all green dots. Then opened each bar. Didn’t make to much sense to me. But everything seemed to be doing what suppose to do. But then have only had this laptop running Windows 10 a couple of months.
You can google anything you don’t understand in the geeky section, but if you’re all green, why bother 🙂
I had the same problem as several others – timed out, then “Data Collection Set” not working, etc. Hopefully, all is well!
Yay – all green. Thanks for your instruction. I feel that little bit geekier now 🙂
The perfmon started well, but it is “collecting data” for more then 10 minutes now> is this normal or should I abort it. If so HOW.
It won’t harm your computer to close the program. Right-click the Performance Monitor’s icon in the taskbar and choose “Close all windows” to stop Perfmon from running.
it s been running for 10 minutes and nothing happened what did i do wrong
I wouldn’t know, I didn’t see what you did. I’m sorry.
I have started the health check but still running after 15 minutes and still collecting data so I am assuming something is wrong.
It’s a standard Windows function. It depends on how much RAM your PC has, how fast it is, and how many errors are found. It can take 45 minutes to an hour. I would let it go for an hour — just to see. But remember it’s not critical to do this process.
I did PERFMON /REPORT opened up just fine, but the window “collection data for 60 seconds has been running for about 5 min and nothing happens after that.
Your computer may be freezing because of a lack or resources or too much multitasking.
I have had nothing but problems with this computer from day one. This report has been running for some time… I hope I can find some answers here!
I’ve been running the report for the last 15 minutes & nothing. Looks like it’s still running though.
It can take a long time (up to an hour) depending on your computer’s RAM, Processor, and hardware.
First method wanted the name of a file. Second time I typed in perfmon and got in, but when I got to “rt. click on sys. diagnostics, then start,” didn’t have “Start” from the upper part of your menu items, only the bottom four items. I looked to the upper right side of the page and saw “Overview of Perfmon” and below that “Open Resource Monitor.” Clicked on “Open” and saw a real-time report, but the info. is confusing to a relative beginner like myself. For someone else it may be helpful.
I’m sorry you found it confusing.